
Documentation
Every step, illustrated.
From a question in your own words to a native Salesforce report — here is exactly what Pulse asks you, what you control, and what gets created.
Prefer a document you can hand to your team?
The same walkthrough, formatted for printing and sharing.
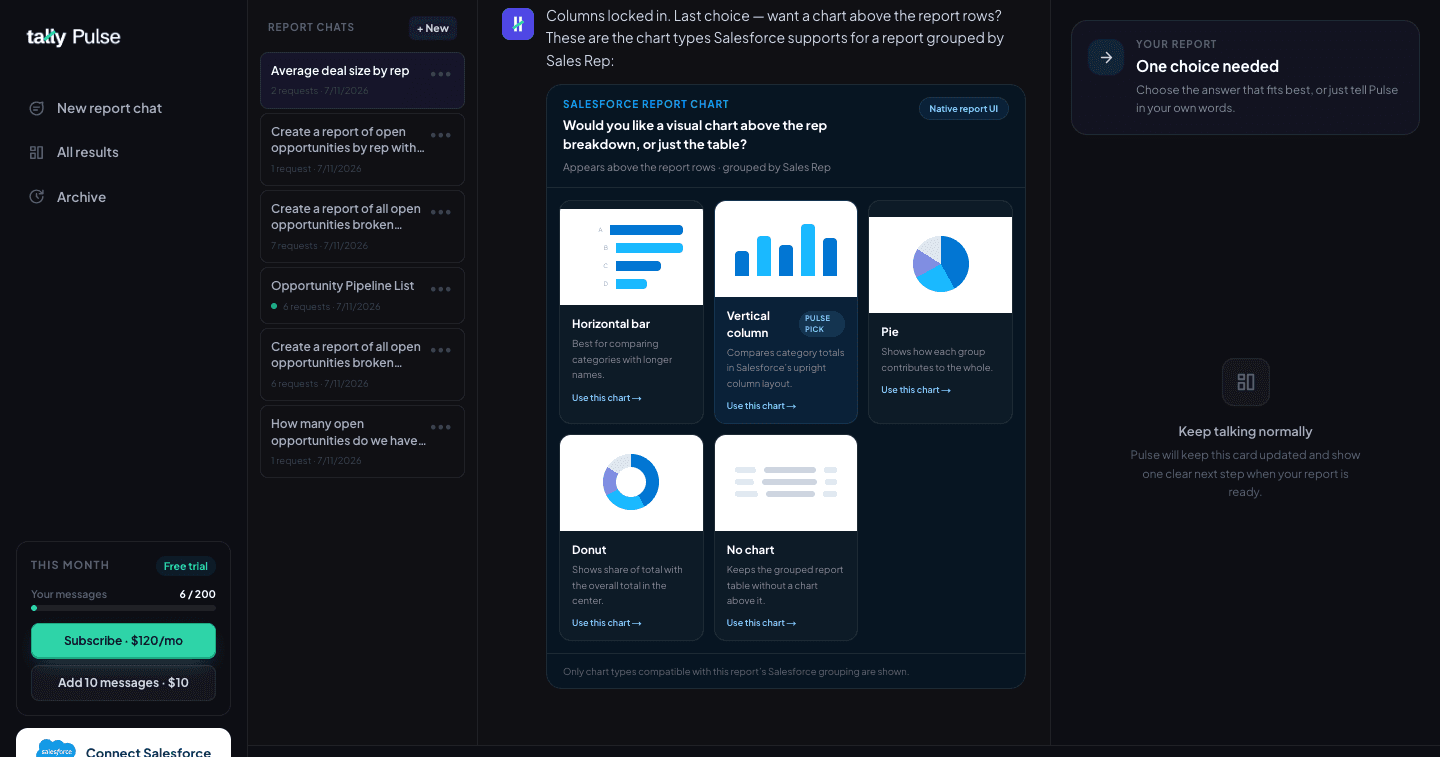
Ask in your own words — get a real answer first
Type what you want to know the way you'd ask a coworker. Before proposing anything, Pulse checks your actual data and leads with the real number, so you know the report will match reality.
Every answer shows its work — expand “See what Pulse did” to see the exact checks it ran.
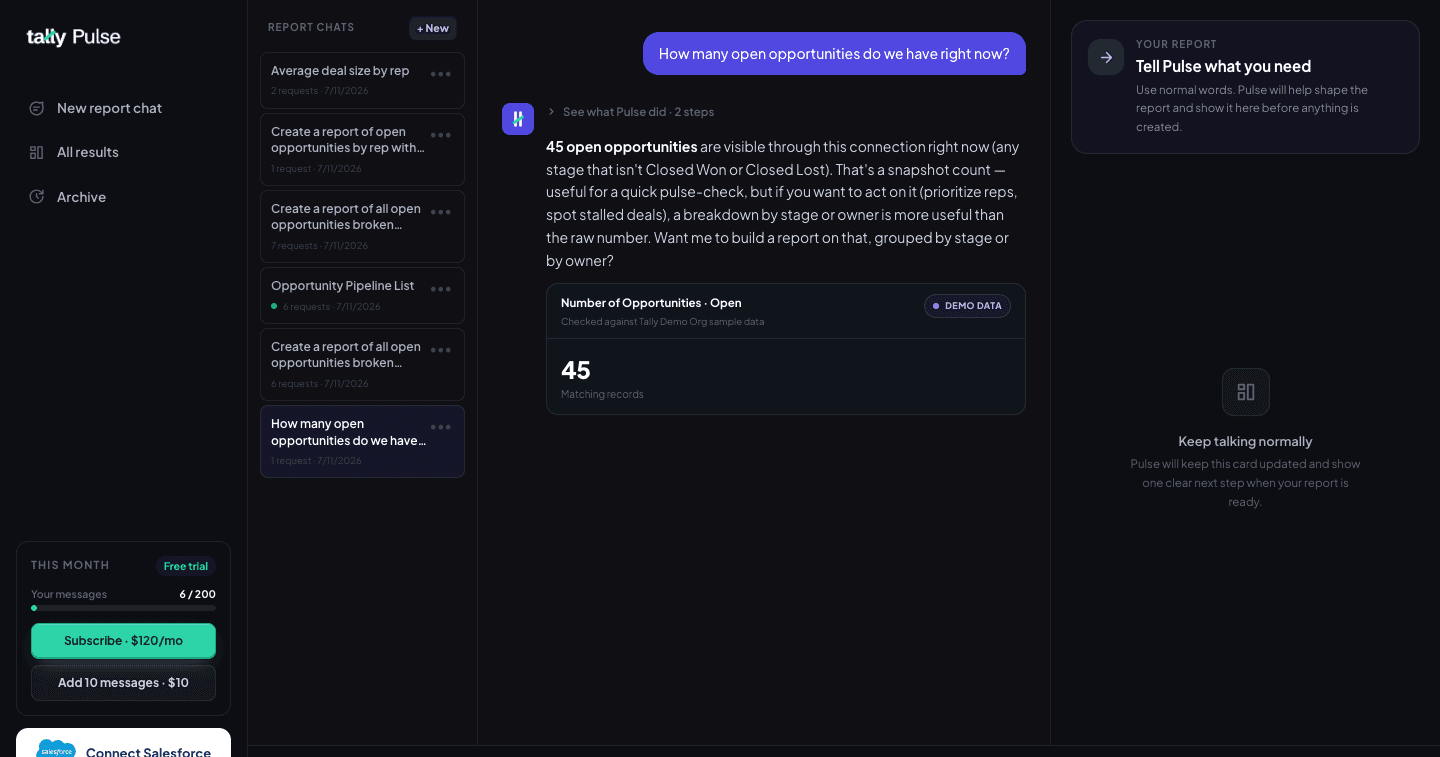
Pick from recommended reports
For broader asks, Pulse proposes 2–3 concrete reports as cards — each naming exactly what it will contain. One is marked as the Pulse Pick, its honest recommendation for your goal.
Cards are offers, not actions. Clicking “Review plan” moves to an exact preview — nothing is created yet.
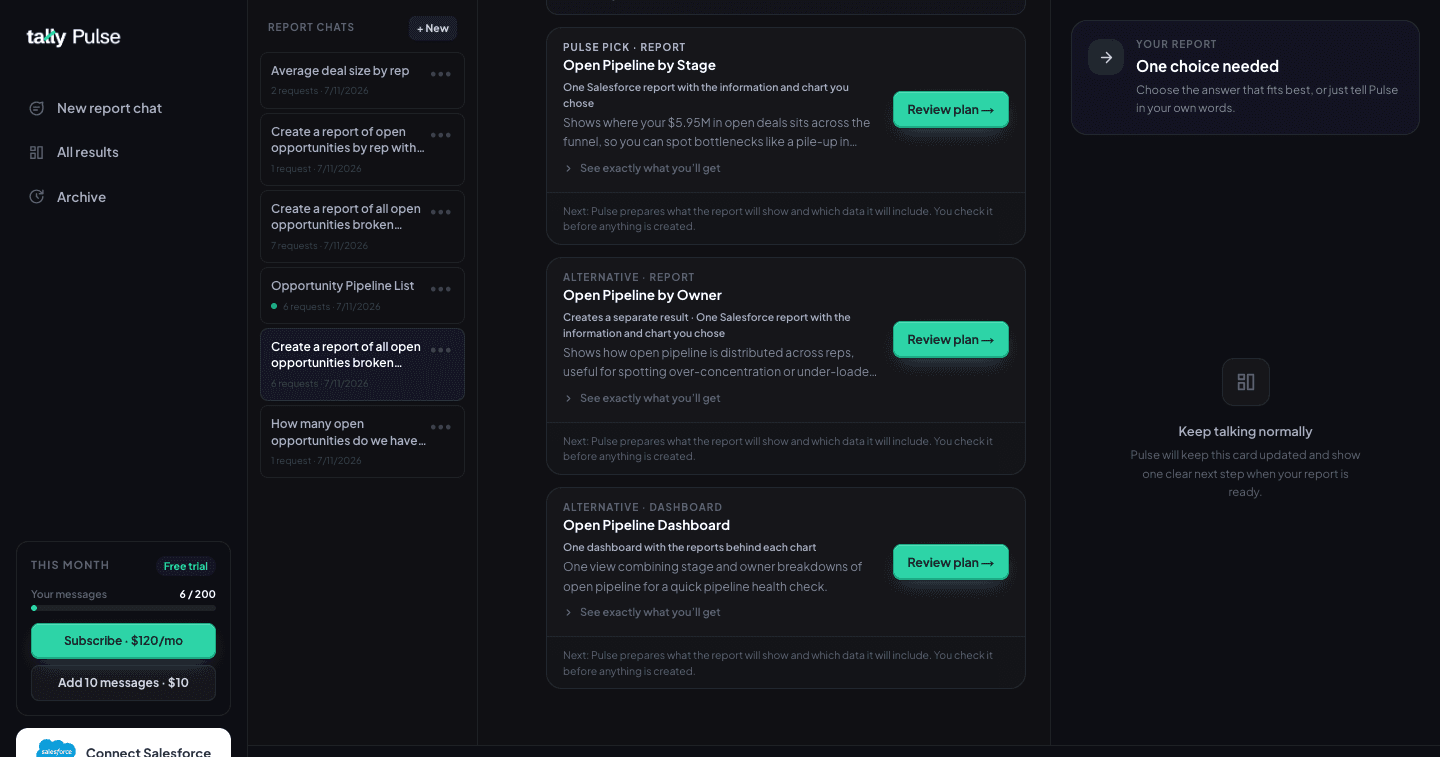
Confirm the columns your report will show
Pulse proposes the row-level columns and explains what each field means in your org and why it's useful. Remove any with one click, or add more from a searchable list of every reportable field.
Field API names stay behind the scenes — you choose columns by their business meaning.
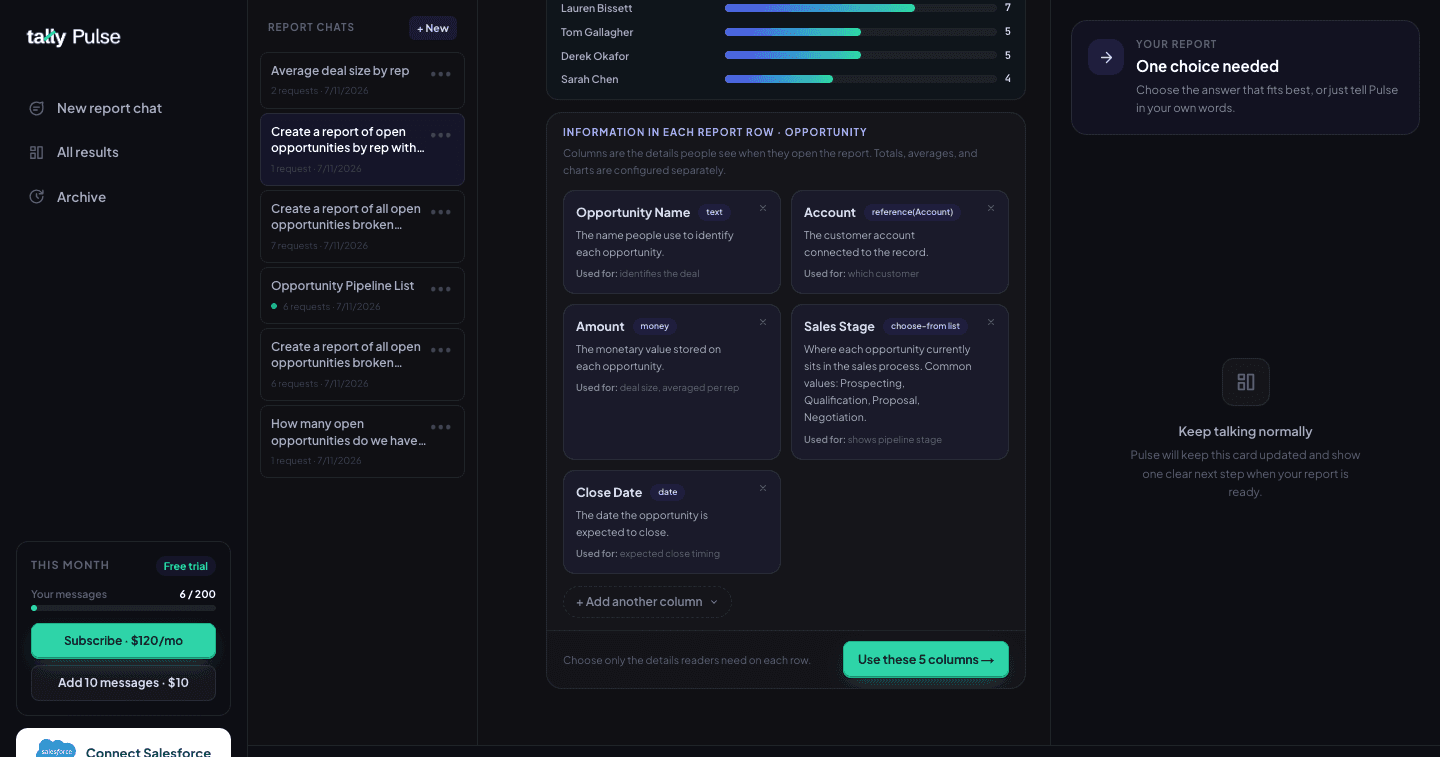
Choose the chart that sits inside the report
For grouped reports, Pulse shows only the chart types your Salesforce grouping actually supports — bar, column, pie, donut, line, or funnel — with a recommendation for your data's shape. The chart is embedded in the native Salesforce report, not a Pulse-only widget.
Rows-only is always available if you just want the grouped table.
Review the blueprint before anything is created
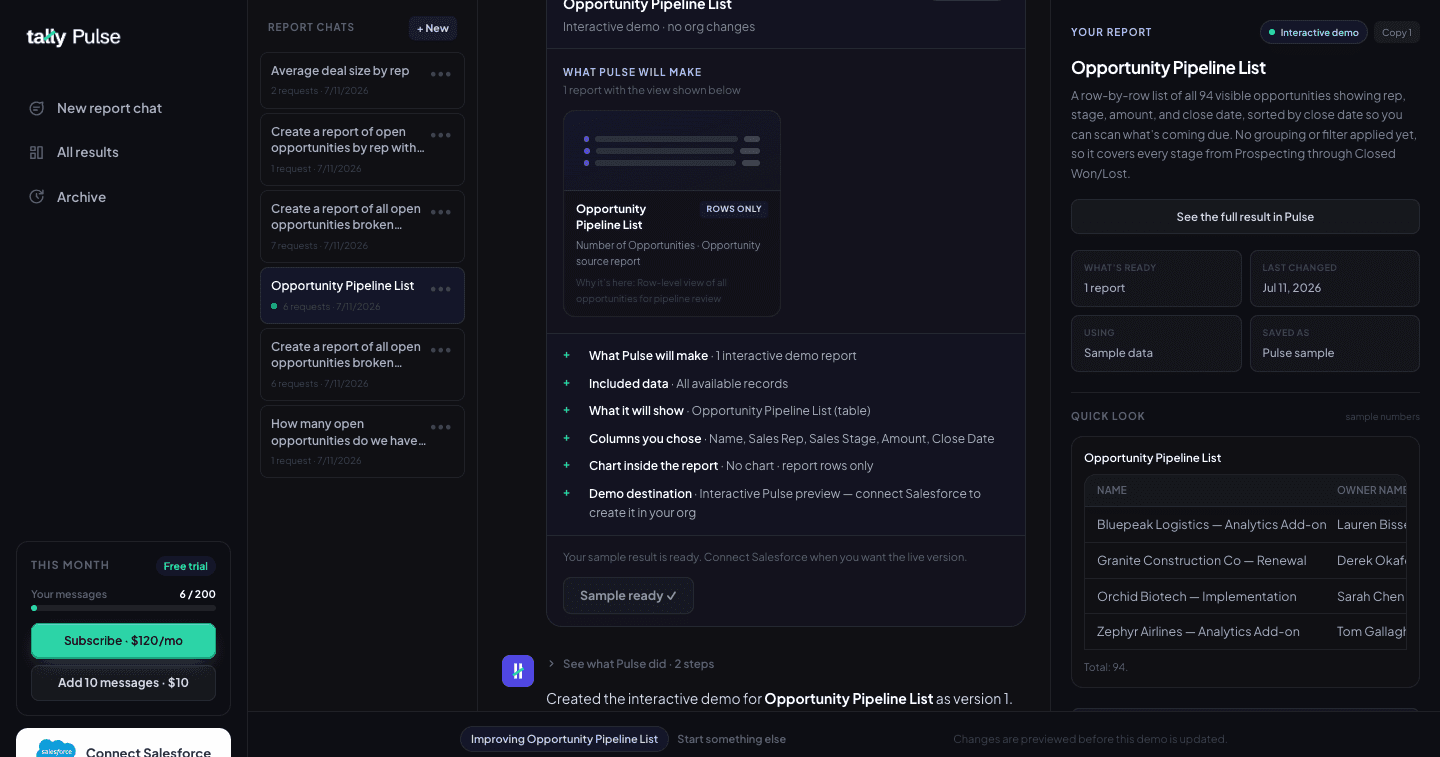
Pulse lays out the complete plan — the data included, the columns you chose, the chart, the calculations, and where it will be saved. Nothing touches Salesforce until you approve this exact plan.
The blueprint is a contract: what you approve is what gets created, verified after the build.
Approve it — then keep refining in your own words
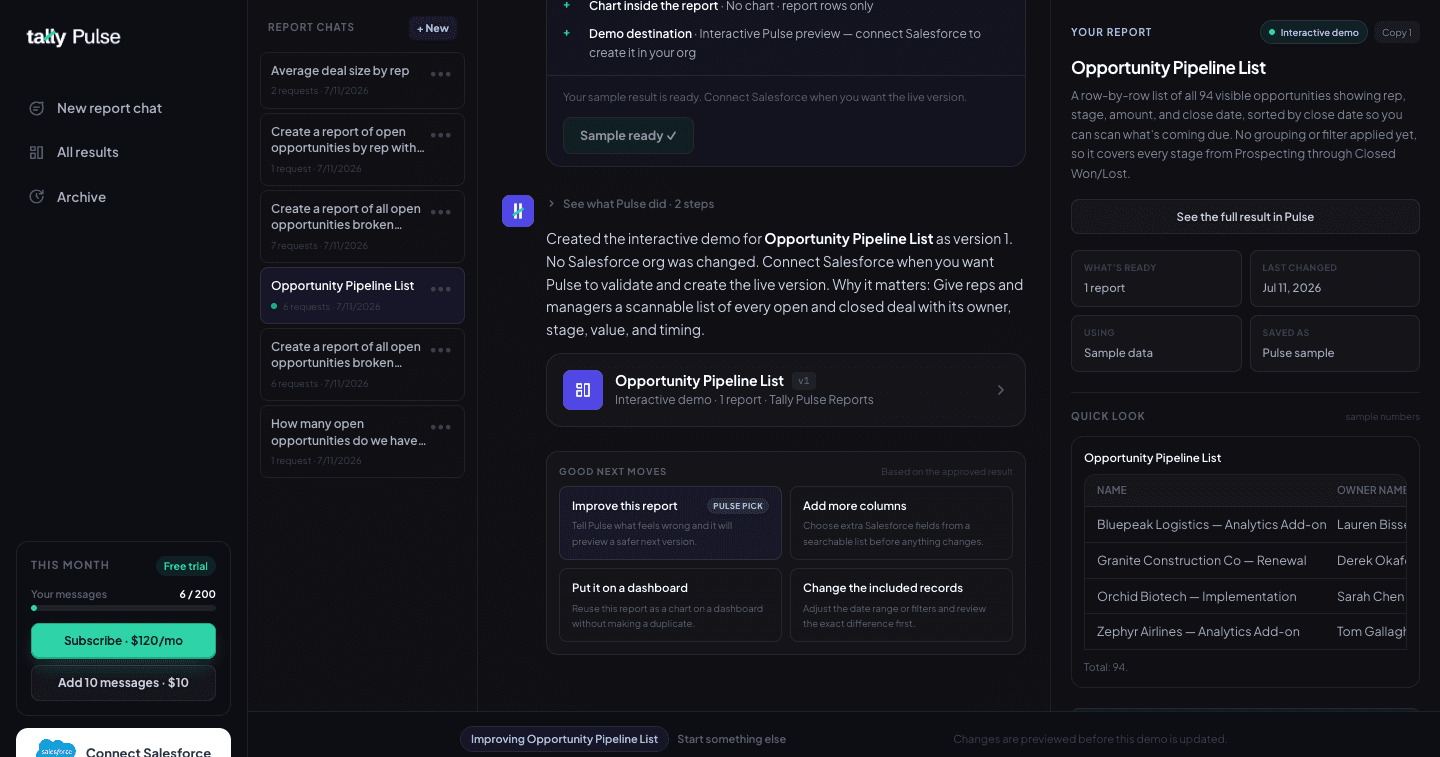
One click creates the real report in a shared Salesforce folder, with a link straight to it. From there, every follow-up is a refinement: change the date range, add a column, swap the chart — each version is saved so you can always go back.
Pulse suggests good next moves after every build, so the next improvement is one click away.
Ready to build your first report by asking?
Create a new report, improve one your team already uses, or build a dashboard. Review the result and publish it directly to Salesforce.
Build a Salesforce report